On the heels of international climate negotiators meeting for the 28th time, this time in Dubai, United Arab Emirates, to reduce global warming emissions, do you know the cost of your own carbon footprint? The social cost of carbon is a two-part question. First, you need to know how much carbon dioxide you emit on a daily basis. Second, you need to put a price tag on those emissions for climate-altering effects that may last for generations.
Calculating your carbon footprint is the easy part, comparatively speaking. With help from an emissions calculator, like this one from the U.S. Environmental Protection Agency, you can plug in the vital statistics of your daily life, like how much gas you buy to drive your car, how much fuel you use to heat your home, and how much waste you generate that otherwise might be recycled.
According to this EPA calculator, the typical American consumer generates emissions in three broad categories:
- Autos: Driving an average of 12,480 miles per year, at 21.4 mpg, consumes 583 gallons of fuel and emits 11,587 pounds of carbon dioxide.
- Home: Burning 192 gallons of home heating oil per year adds another 4,859 pounds of CO2 emissions (per family resident). This EPA calculator also converts emissions from natural gas, propane and electricity.
- Waste: Annual consumption of aluminum and steel cans, glass, plastic, newspapers and magazines contribute another 692 pounds of CO2 emissions that might otherwise be avoided through recycling.
While this is by no means an exhaustive list, it adds up to 17,138 pounds of annual CO2 emissions, or 8.569 tons, for the “average” American citizen.
Pricing the Social Cost of Carbon
Now comes the tricky part: What social costs do you assign to these CO2 emissions, since they aren’t fully priced in the marketplace? The math itself is pretty simple. The EPA puts the combined social and environmental costs of these emissions at $190 per ton, which works out to $1,628 per year for the average American citizen. However, the assumptions underlying this equation are far more complicated.
To build out its carbon pricing model, the EPA has conducted detailed technical studies and invited peer review of its evolving methodologies for nearly two decades. As scientists have linked these emissions to rising costs of extreme weather events, like floods, droughts, heat waves and wildfires, estimates of the social costs of carbon have grown considerably higher. The EPA’s 2022 technical analysis can be accessed here.
This is not just an academic exercise, by the way. It’s how the EPA evaluates regulatory proposals to control greenhouse gas emissions – like one announced in early December calling for an 80% reduction in methane emissions by the oil & gas industry. Since methane has 84 times the global warming potential of carbon dioxide, these methane emission reductions by 2030 could have the same impact as removing 28 million gasoline vehicles from the road.
A Brief History Lesson
While economists have been trying for decades to express the social costs of climate change in dollar terms, these estimates did not enter the regulatory arena until Barack Obama was president. His administration placed the initial social cost of carbon emissions at $43 per ton of CO2 equivalent. The Trump administration carried on this cost-benefit analysis, but limited its scope to U.S. climate impacts, dropping the estimated social cost range to only $3 to $5 per ton.
When the Biden administration came to office in 2021, it reinstated the broader global scope of this exercise and raised the social cost estimate back to $51 per ton. After two years of additional review, the EPA issued a 182-page technical report in November 2022 that documented the scientific and economic methods used to assign damages to livelihoods, property values and important commodities. These findings were used to justify raising the social cost of carbon nearly fourfold to $190 per ton.
Now, the projected economic benefits of new clean-air rules for vehicles, power plants and refineries each add up to more than $1 trillion, which is well above the estimated costs of regulating emissions in these affected industries.
Cost-benefit analysis is not the only means by which one can assess the value of climate regulations, however. Several prominent economists, including former chair of US Council of Economic Advisors Joseph Stiglitz and former UK climate advisor Nicholas Stern, favor “target-consistent pricing” of CO2 emissions. This alternative approach adjusts yearly abatement costs based on progress toward long-term emission reduction targets. Cost-benefit analysis takes a back seat to achieving these overarching policy goals.
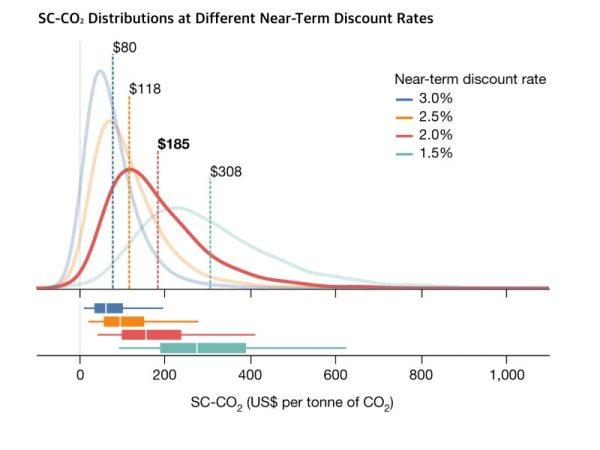
Economic cost-benefit analyses also apply a discount rate of future outcomes that can greatly affect the price of avoided carbon emissions. For example, the current price of $190 per ton applies a 2% discount rate for each year that benefits are measured into the future. A higher discount rate of, say, 2.5% assigns less value to what happens in future years, shrinking the estimated social cost of carbon to only $120 per ton. By contrast, a 1.5% discount rate places a higher value on future years and raises the social cost of carbon from $190 to $340 per ton. The higher the estimated value of carbon emissions abatement, the more regulatory proposals are likely to pass muster under such cost-benefit analyses.
Fifth National Climate Assessment Issued
Regardless of where the social price of carbon goes from here, the first-order goal remains to have cost-effective regulations that mitigate the rising costs of climate change on current and future generations. This is where the latest National Climate Assessment comes in, written by a phalanx of U.S. government agencies and academic researchers. Issued on Nov. 14, this government report – the fifth in a series dating back to 2000 — chronicles our nation’s latest climate trends and progress toward achieving greenhouse gas reduction goals.
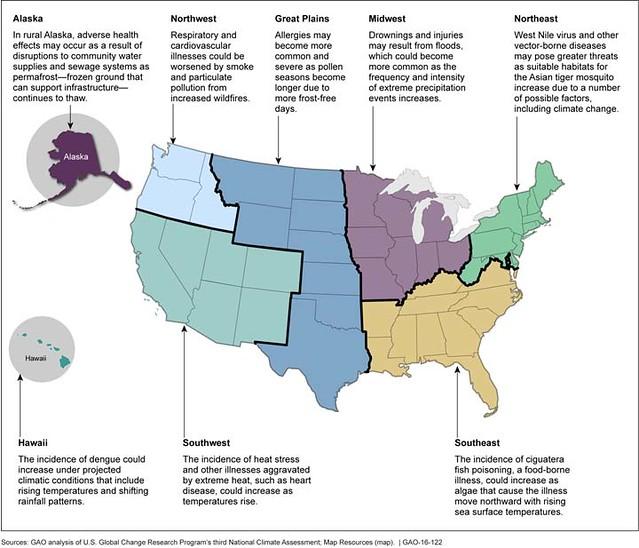
This fifth compendium covers 17 topics of broad national interest and breaks down climate impacts into 10 geographic regions. We devote the remainder of this post to highlighting some of the observed climate and weather trends in the Northeast, home to 67 million people. Then, you can be the judge of whether this adds up to $1,628 in annual social costs of CO2 emissions (or more or less) for each resident who lives here.
Human health and mortality
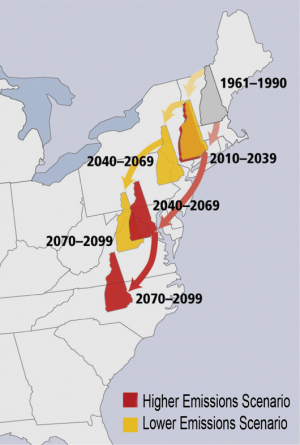
In the Northeast, temperatures have risen more than 2°F since the 1880s and are on track to rise another 2.5°F to 8°F by the 2080s. The frequency, intensity, and length of deadly heat waves is also expected to triple by 2050. This ongoing warming trend is increasing heat-related deaths in the Northeast and decreasing air quality, especially in urban areas. Residents in rural and underserved communities that lack access to air conditioning are at greater risk, along with infants, the elderly and those with chronic respiratory ailments like asthma.
Other adverse effects of climate change on human health includes a longer pollen season for common allergens like ragweed. Warmer and wetter conditions also increase seasonal activity and the extent of suitable habitat for ticks and mosquitoes, elevating the risks of human exposure to vector-borne diseases like Lyme disease and West Nile Virus. More frequent and extreme flooding events also threaten to overwhelm storm water and sewage treatment systems, reducing reliable access to clean water and spreading exposure to waterborne illnesses. Maintenance and adaptation costs for critical infrastructure could soar.
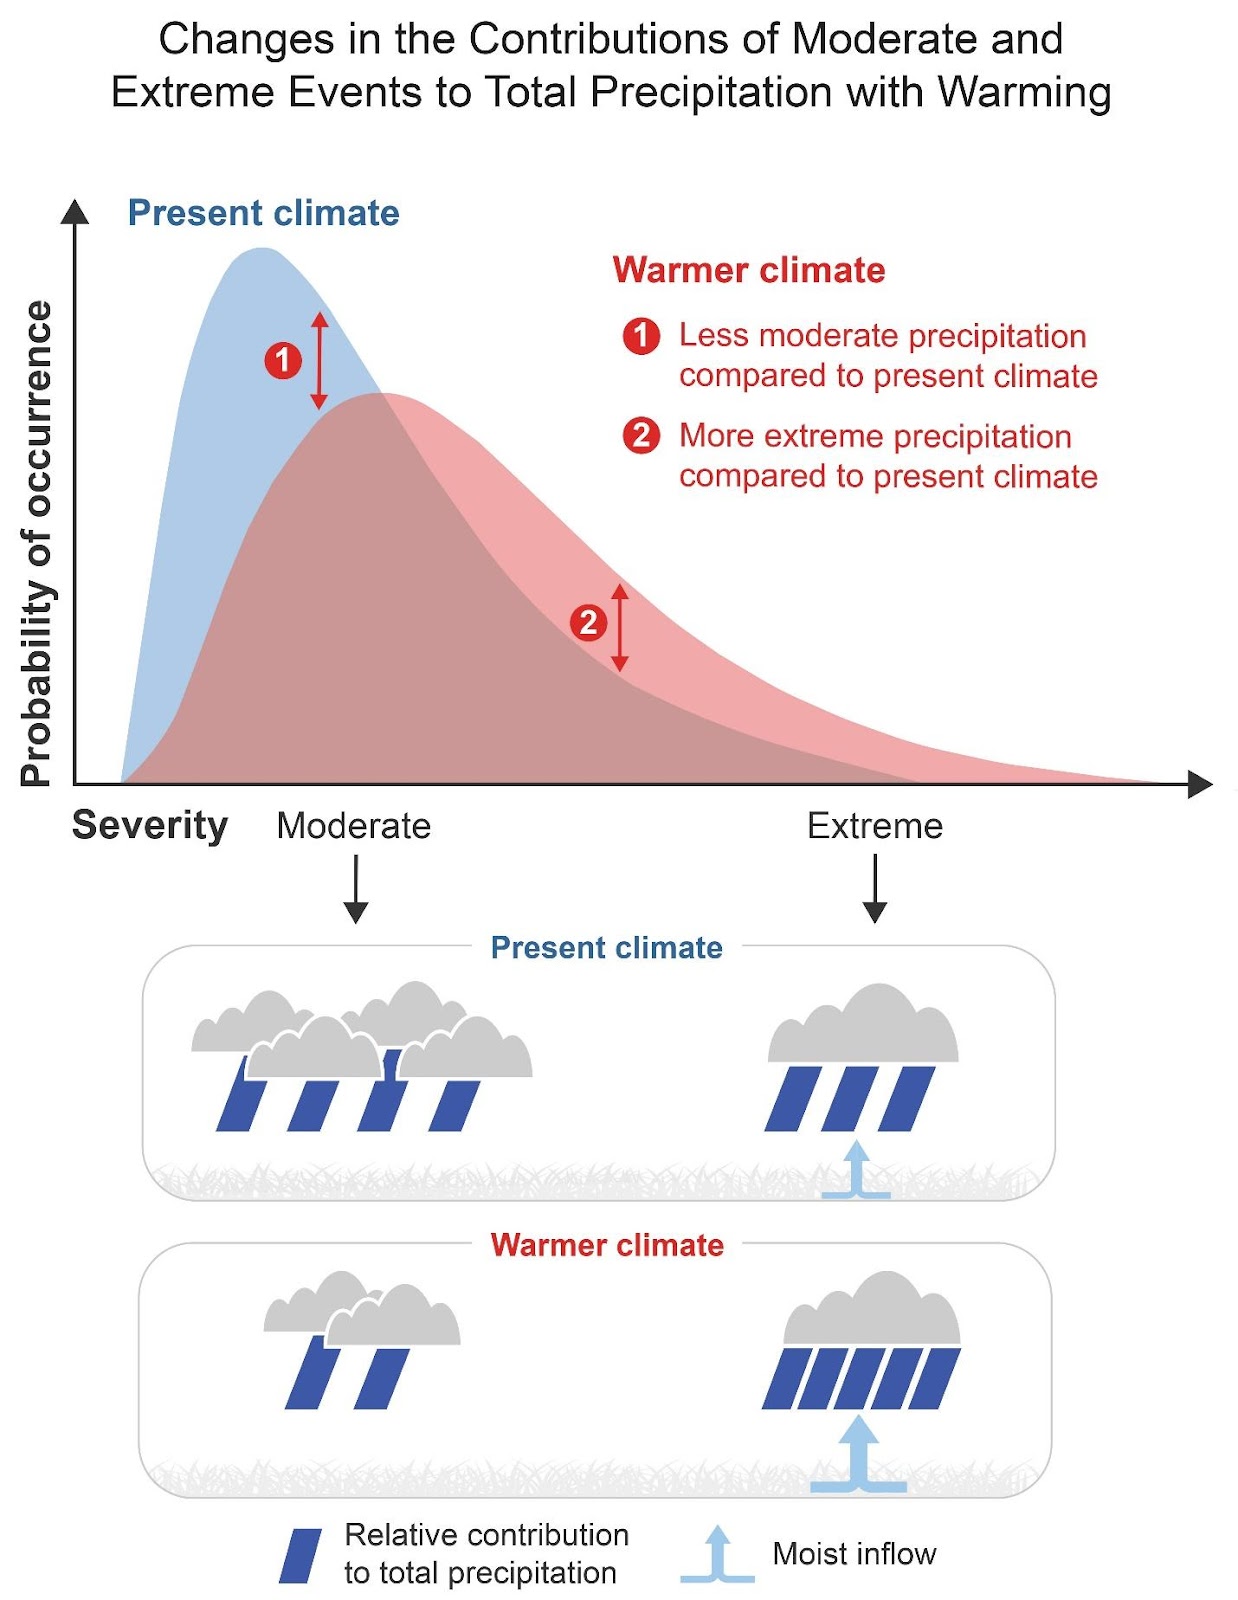
Precipitation, flash flooding, and sea level rise
The Northeast has witnessed a greater increase in flash flooding and total rainfall than any other U.S. region, with extreme precipitation events rising 60% over the last 65 years. Warmer ocean waters, more tropical storms, and a more humid atmosphere all are contributing to this precipitation increase, which produced record flooding in Vermont last summer.
Meanwhile, sea level rise has been approximately 1 foot in the Northeast since 1900, causing more frequent flooding of some coastal areas. The combined effects of these warming waters and local land subsidence (sinking) are causing sea level to rise faster in New England than the global average of at least 1 to 4 feet by the end of this century. In Boston alone, the projected increase in coastal flooding could cost up to $94 billion from damage to buildings, loss of building contents, and associated emergency activities. In nearby New York and New Jersey, home buyout programs and multibillion-dollar flood protection initiatives are already underway.
Agriculture, forestry, and fisheries
Climate change is also affecting the Northeast’s agricultural and forestry base in fundamental ways. Rising temperatures and warmer conditions are increasing heat stress in dairy and livestock, reducing milk yields and calf birth rates. Over time, longer, drier summers may reduce water availability and increase plant heat stress, also reducing crop yields. Warmer spring temperatures may also be interrupted by cold snaps, causing frost damage to fruit-bearing trees and bushes, as happened this spring in New England, while warmer winters and longer growing seasons spread incursions of weeds and pests. Eventually, large swaths of the Northeast may become unsuitable for growing certain fruits, like apples and blueberries, as well as crops like soybeans.
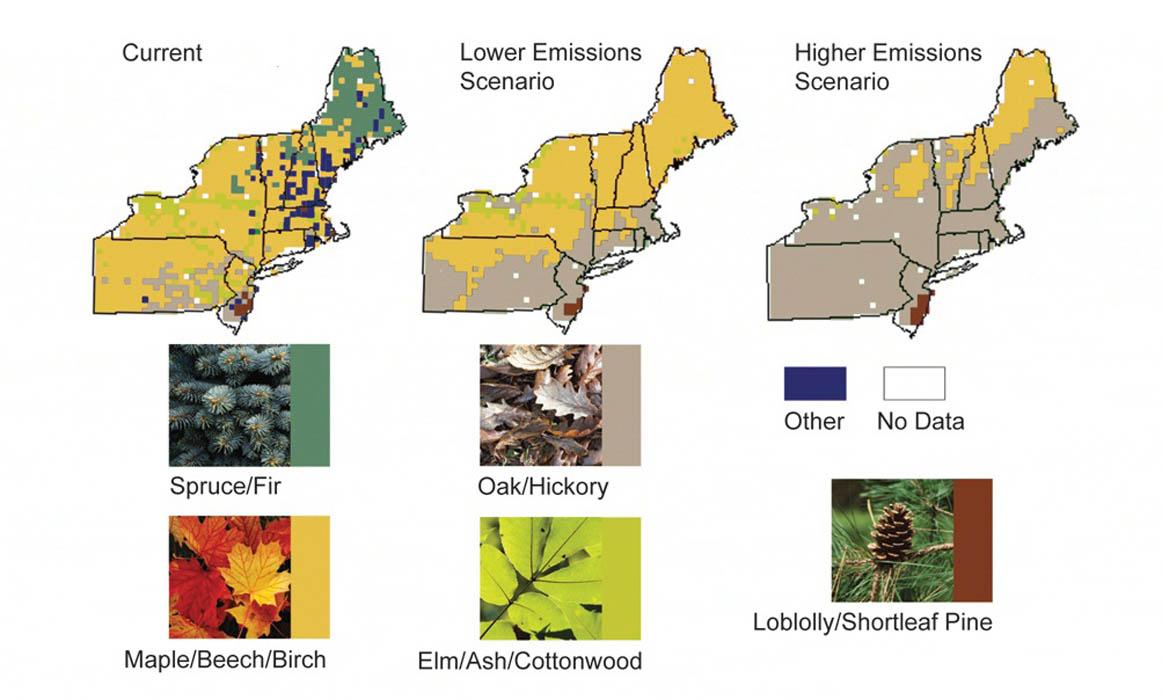
In forest habitats, the range of economically important tree species, like the sugar maple, is expected to migrate out of the Northeast and into Canada, as its preferred climate shifts north. Warmer temperatures also invite more outbreaks of forests pests and pathogens, such as the emerald ash borer and hemlock woolly adelgid. Growing deer populations are degrading forest understories (not to mention home gardens!). Seasonal temperature changes also are advancing the timing of important ecological events, such as when birds migrate and when plants bloom in the spring.
Offshore, many commercially important marine species are moving northward as the region’s ocean waters warm faster than just about anywhere else on the globe. This is causing local declines in valued commercial species like lobster, scallops, shrimp, oysters and cod. Right whales also are on the move from the Gulf of Maine to find cooler breeding and feeding grounds north of Nova Scotia.

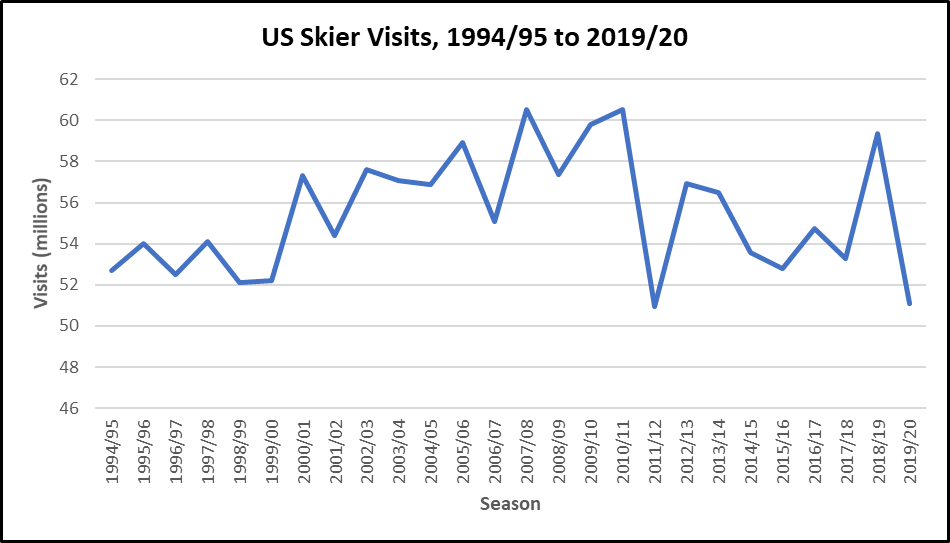
Tourism and winter sports
Finally, the Northeast has long been a major tourist attraction for summer getaways, fall foliage tours and winter recreation like snowmobiling and downhill skiing. As the average length of the Northeastern winter season shrinks to under 100 days per year, ski operators must rely more on artificial snowmaking to stay in operation, especially during winter holidays when tourist visits are at their peak. Going forward, struggling ski areas may close, and those that remain open will have to invest more in snowmaking equipment, raising costs to customers. Average lift ticket prices have already quadrupled in the Northeast in the last 30 years (before adjusting for inflation).
Reducing Your Carbon Footprint… and the Social Cost of Carbon
In sum, rising carbon dioxide emissions shortens lifespans, hurts crops, diminishes fisheries, causes sea levels to rise, and decreases property values and tourism. Whether it adds up to $190 per ton in aggregate (or more or less) takes on an economist’s perspective. (Ultimately, the courts may weigh in as well.) But for now, the advertised benefits of new clean-air rules for vehicles, power plants and industry add up to more than $1 trillion in these categories, far outweighing the anticipated regulatory costs for each of these affected industries.
For more information on how you can reduce your home carbon footprint by using Solaflect Trackers, or your EV/hybrid commuting carbon footprint with a workplace Solar EV Charger, email us or call (802) 649-3700. For 15 years, Solaflect Energy has been your energy management partner. Working together, we can make a difference in the fight against global warming and produce affordable clean energy in our communities!

