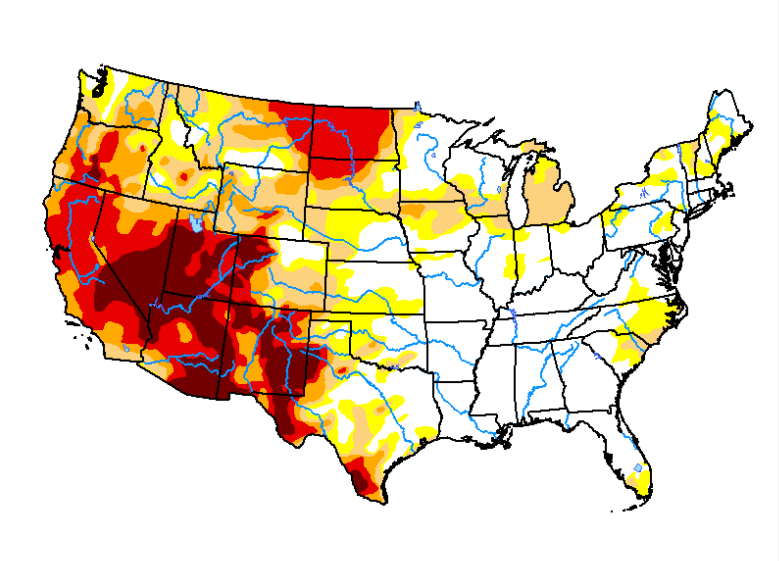
Each decade, the U.S. National Oceanographic and Atmospheric Administration (NOAA) updates its analysis of U.S. weather patterns by comparing temperature, precipitation and other meteorological trends over the past 30 years against longer-term records dating back more than a century. In a newly released update — comparing temperature increases in 1990 – 2020 against 30-year time frames over the 20th century – the map’s visual imagery shows a pretty shocking temperature increase trend over the last 50 years, in particular.
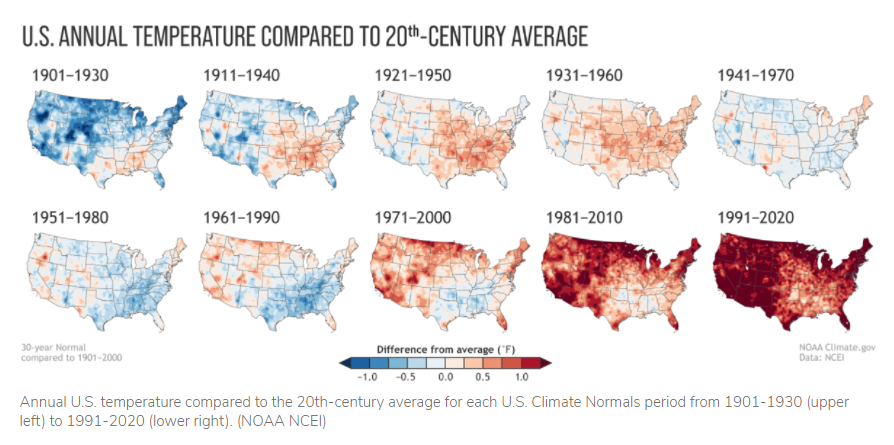
NOAA has set this new update as the baseline for a “new normal” to track 21st century weather trends. Be sure to pack lots of sunscreen! Our nation has gone from cool blue to hot red in the blink of a climatological eye – a 2.5-degree F average temperature increase over the last century.
Summer Outlook – and for the rest of 2021
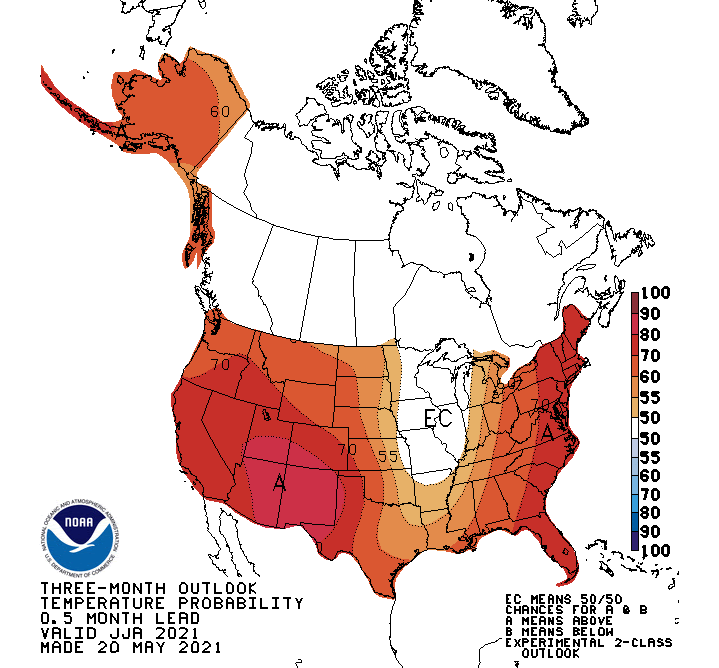
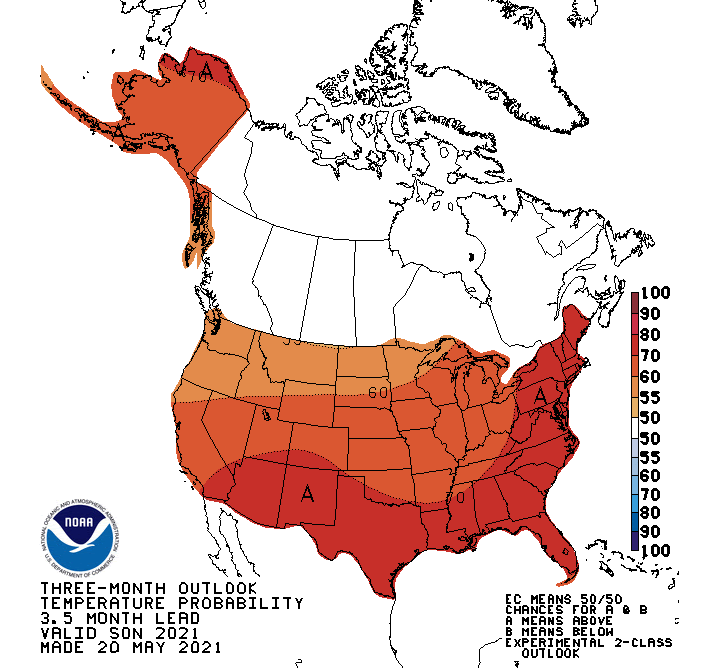
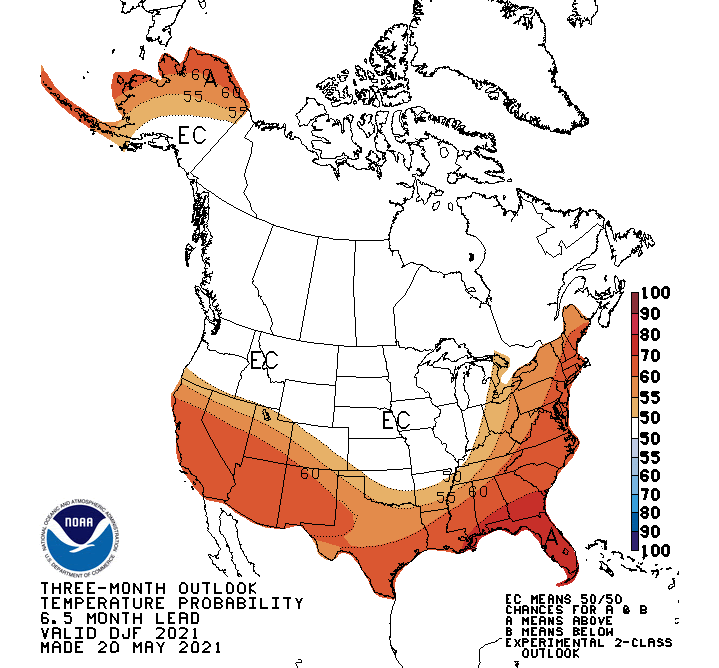
NOAA’s short-range weather outlook looks like a grim harbinger of what’s still to come. This summer, only the Upper Midwest is expected to catch a break from temperatures that are trending above even the “new normal” range of the last 30 years. And even that mid-continental “oasis” is expected to disappear by this fall, as above normal temperatures sweep all across the country and up into Alaska. Here in New England, warmer-than “normal” weather is expected to persist at least through next February.
NOAA Online Climate Tool
Want to drill down even further on where you live? NOAA has a great new tool that you can use to track climate trends right down to the state and county level. You can plot changes in average temperatures and temperature extremes as well as total precipitation trends.
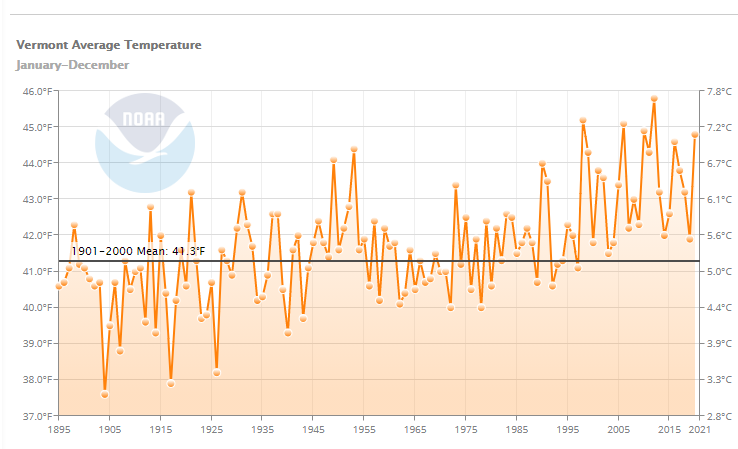
Below we’ve plotted average annual temperatures for Vermont since 1895, and annual average precipitation changes for Grafton County, NH, over the same period.
Note that Vermont hasn’t had any years in the 21st century that rank below the mean annual average temperature of 49.3° F recorded in the 20th century. This summer’s ominous forecast bears an eerie resemblance to 2012, when a series of vicious summer thunderstorms pounded our region, washing out roads and causing other serious property damage. Vermont posted an all-time high temperature record that year, which blew away the old record by 0.6° F, a huge jump by meteorological standards.
,
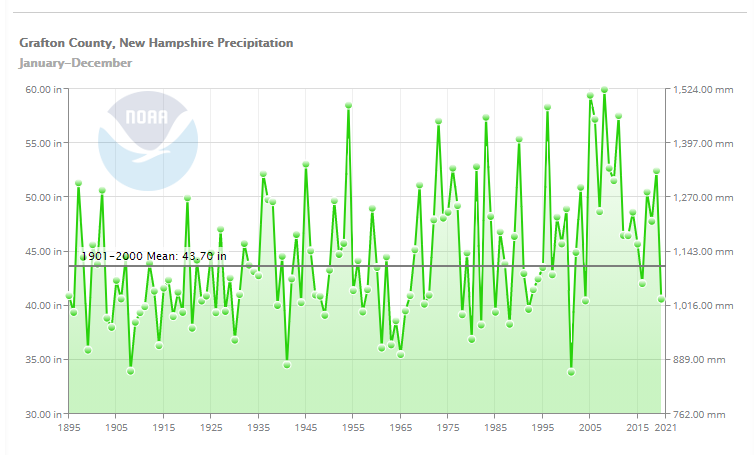
Note, as well, that Grafton County has had only four years of below-normal rainfall since 2000. Compared to the gradual (but accelerating) global warming trend, however, our region’s precipitation pattern has been much more volatile and uneven. In the 21st century, Grafton County has already notched both its driest year (2001) and wettest year (2009) in the 125-year historical record.
But, overall, the precipitation trend is still on the way up in New England. Relatively speaking, that’s probably a good thing, especially compared to the American Southwest, where the worst drought in more than a millennium rages on!

With more hot summer weather heading our way, now is the time to update your home energy plan. It’s always a great time to harvest all that renewable energy with solar, and adding an electric heat pump can help you stay cool this summer (and, yes, keep you warm next winter!). Reach out for more ideas on how to make your home a force for good in the fight against global warming. Together, the power is in our hands to make a difference!

